Latest Insights

Illustration of four people standing in a line, listening to a man who is pointing and speaking to a group about "Wardley Mapping."

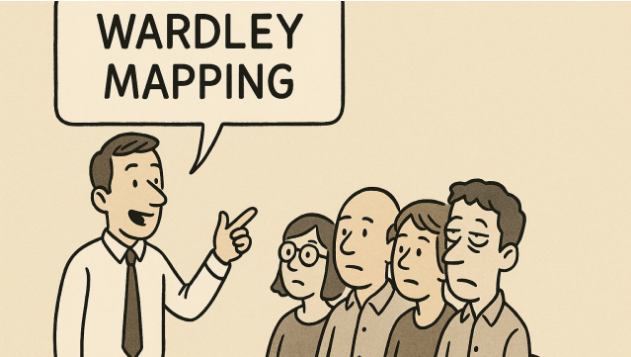
29/1/2026 Not leading with the label: How to introduce transformative techniques without overwhelming your teams

Diagram illustrating a user needs map with multiple capabilities represented as a North Star, with the user at the center and various capabilities radiating outward in a star shape.

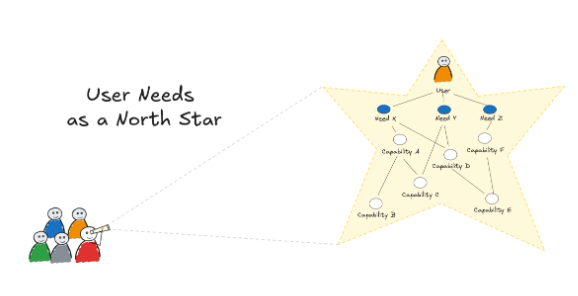
21/1/2026 User Needs as a North Star: a Key Insight From DORA on AI Adoption

Flowchart illustrating different project development stages from opportunity selection to run, including phases like design, build, test, release, and run, with various team archetypes
Cartoon of two stick figures having a conversation. The figure on the left, dressed in a blue suit, says, "We deliver a great customer experience!" The figure on the right, wearing glasses and an orange shirt, responds, "It doesn't feel like it."
A whiteboard displaying a user needs map, with a person pointing at the diagram. Five people sit in front of the whiteboard, with speech bubbles; one has a question mark, and another asks, 'Who is this serving?'

Read more of my insights on Linked In